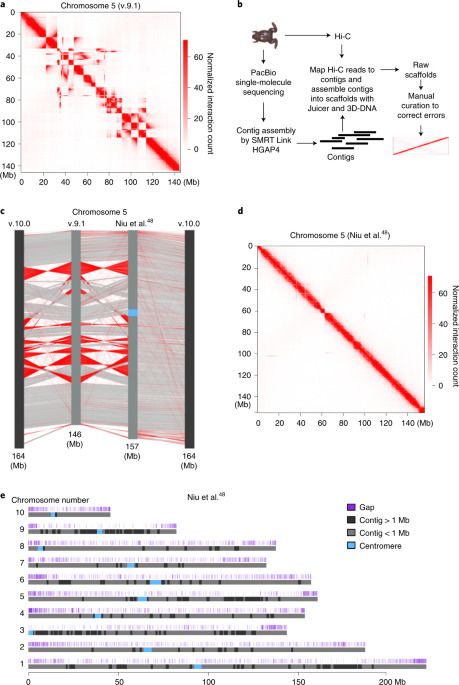
While carrying out high-throughput chromosome conformation capture (Hi-C) analysis on stage 8 (s8) X. tropicalis embryos, we noticed that chromatin interactions plotted at 100-kilobase (kb) resolution using the reference genome v.9.1 showed inversions, misplacements and gaps in nearly every chromosome (Fig. 1a and Extended Data Fig. 1). Thus, to accurately characterize the genome folding patterns in X. tropicalis, we conducted a de novo genome assembly of X. tropicalis using Hi-C and single-molecule sequencing42,43,44 (Fig. 1b). The newly assembled genome fixed most misplacements, inversions and gaps (Fig. 1c, d, Extended Data Fig. 2 and Supplementary Fig. 1). This new version of the genome was also longer (Supplementary Table 1 and Fig. 1e) and centromere interactions can now be detected (Supplementary Fig. 2). During the preparation of this work, v.10.0 of the X. tropicalis genome was released. While both v.10.0 and our assembly fixed major errors, both versions are still flawed with visually identifiable errors (Supplementary Fig. 1; blue and green arrows). A comparison of the three versions is shown in Supplementary Table 1. Conclusions from the following analyses are the same whether we used v.10.0 or our assembled genome.
To examine when the 3D chromatin architecture is established in X. tropicalis, we generated in situ Hi-C maps on hand-picked s8 embryos (Fig. 2a). A high-resolution (5-kb) inspection of chromatin contact heatmaps failed to reveal any distinct patterns (Fig. 2b), indicating the lack of structural organization before MBT. Next, we determined whether chromatin structures will emerge when rapid synchronized cell division ends by carrying out in situ Hi-C on s9 embryos. Although weak, TAD-like structures appeared across chromatin contact heatmaps (Fig. 2b), suggesting that TAD structures start forming as MBT begins in X. tropicalis.
We continued to examine the changes in chromatin conformation at later developmental stages (stages 10, 11, 12, 13, 15, 17, and 23) after major ZGA (Fig. 2b). TAD boundaries increased progressively from 2471 at s9 to 3000 at s11 (Extended Data Fig. 3a, b). This level was maintained throughout the later developmental stages and with relatively stable median TAD sizes (Extended Data Fig. 3a, b). Consistent with this pattern, the percentage of the genome folded into TADs positively correlated with the number of TADs established at each stage (Extended Data Fig. 3c). Overall, TAD borders were stable during development (Fig. 2c) and contained a high level of gene expression (Extended Data Fig. 3D, e).