Researchers at ETH Zurich have developed a method that uses a single ion to detect electromagnetic fields above a surface and to create a three-dimensional map of them. In the future, this approach can be used to improve chips for quantum computers and quantum sensors.
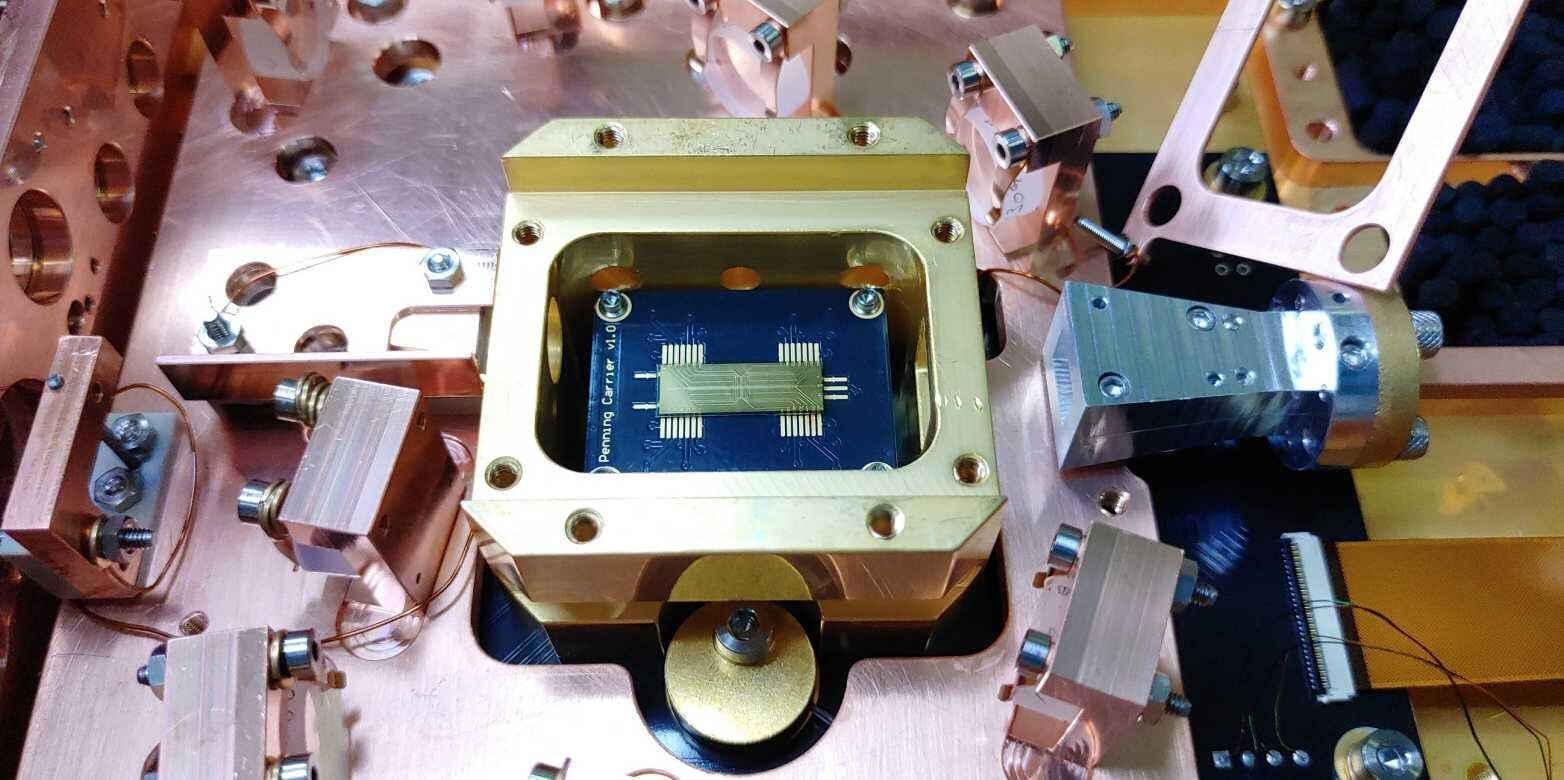
Single electrically charged atoms—ions—have been successfully used for some time as quantum bits in quantum computers and quantum sensors. Unlike the bulky ion traps of the early years, there are now miniaturized chips in which ions can be trapped and manipulated only a hair’s breadth above the surface of the chip. This has many advantages, but also one decisive drawback: Noisy electromagnetic fields coming from the chip itself can severely impair the sensitive quantum states of the ions and hence the performance of the computer or sensor.
A team of researchers led by Jonathan Home, a professor at the Institute for Quantum Electronics at ETH Zurich, has now developed a technique that allows them to create a very precise three-dimensional map of electric and magnetic fields very close to the surface of the chip. In the future, materials for chip production can be better optimized and tested for their suitability for use in quantum applications. The results of their research were recently published in Science Advances.

