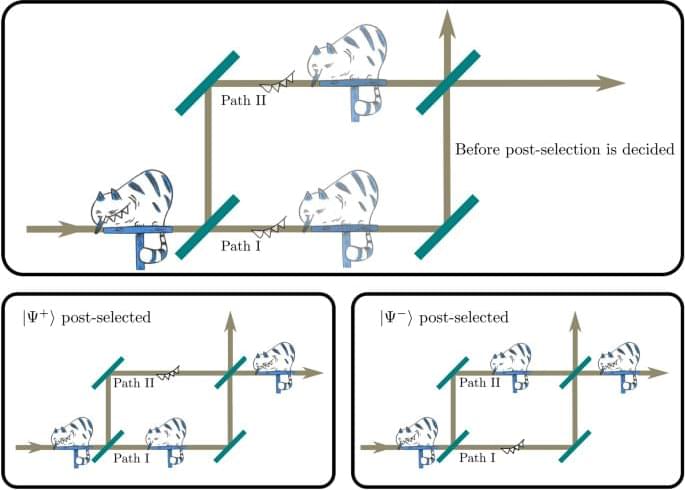
The Eqs. (3a) and (3b) suggest two important features of the location of neutrons and the spin by switching the choice of the post-selection: (i) The first lines indicate that the neutrons are found to be localized in different paths by switching the choice of the post-selection; they are found in the path I and II by applying the post-selection \({|{\Psi ^{+}_f}\rangle }\) and \({|{\Psi ^{-}_f}\rangle }\), respectively. (ii) The lines of the second part of the equations indicate that the spin in the different paths is found to be affected by switching the choice of the post-selection; the spin in path II and I is affected by applying the post-selection \({|{\Psi ^{+}_f}\rangle }\) and \({|{\Psi ^{-}_f}\rangle }\), respectively. Note that, in both choices of the post-selection, neutron and spin are localized in different paths, i.e., the location of the cat itself and its grin are interchanged by switching the choices of the post-selection. Since measurement of the locations of the neutron and the spin in the interferometer can be carried out independently of the delayed-choice process, the picking of a direction for post-selection, the influence of the delayed-choice on the preceding measurements can be investigated. We would like to point out that the experimental proposal in a recent publication35, contains a delayed choice scenario, too. The difference to the experiment presented in this report is that the authors of35 suggest a setup where two properties of the same system, represented by two non-commuting observables, are separated. In contrast to that, we deal in our experiment with the separation of one property from the system itself, hereby constituting the phenomenon of disembodiment. Further we would like to point out that in their Gedanken-experiment the effect of a change in the pre-selection is discussed that in our view has no retro-causal implications.
The experiment was carried out at the S18 silicon-perfect-crystal interferometer beam line at the high flux reactor at the Institute Laue Langevin. A schematic view of the experimental set-up is shown in Fig. 2.
