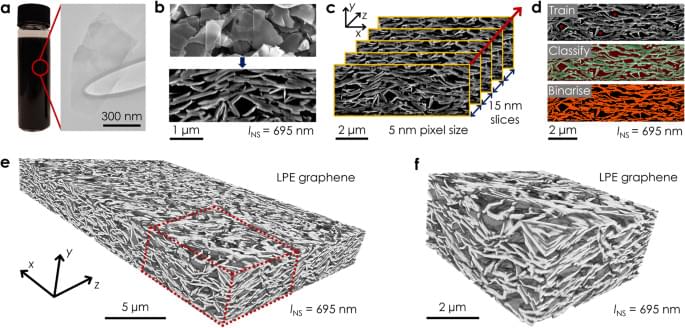
It is well-reported that solution-processed nanosheets tend to restack during deposition57. We determined the degree and nature of this restacking by measuring the nanosheet length and thickness in the ink (lNS, tNS) using AFM, as well as the aggregated nanosheet dimensions in the network (lNet, tNet) post-deposition. The restacked nanosheet length and thickness were measured from network cross-sections using the Ridge Detection plugin in FIJI50,58 (Fig. 2e, inset, and Supplementary Note 9). We define the aggregation factors in nanosheet length, χl, and thickness, χt, as \({\chi }_{{{{{\rm{l}}}}}}={l}_{{{{{\rm{Net}}}}}}/{l}_{{{{{\rm{NS}}}}}}\) and \({\chi }_{{{{{\rm{t}}}}}}={t}_{{{{{\rm{Net}}}}}}/{t}_{{{{{\rm{NS}}}}}}\) respectively. Values of χl ≈ 1.5 and χt ≈ 5.6 were found for the printed LPE graphene network in Fig. 2e. This is in agreement with a value of χt ≈ 5 reported for vacuum filtered WS2 networks59, and suggests that nanosheets primarily aggregate through vertical restacking with maximised basal plane overlap.
By isolating discrete nanoplatelets and noting their orientation (Fig. 2f, inset, and Supplementary Note 10)60, the distribution of angles, φ, between each nanoplatelet’s normal vector and the out-of-plane (y) direction was calculated. The data in Fig. 2f was fit with a Cauchy-Lorentz distribution centred on φC ≈ −0.6˚, which suggests the nanosheets are primarily aligned in the plane of the film. The full width at half maximum (FWHM) of the distribution provides an estimate of the degree of alignment about φc in the network61. The FWHM of (29 ± 1)˚ for the spray cast network in Fig. 2f is comparable to a value of 21˚ for an inkjet-printed graphene film measured using AFM. In addition, we measured the Hermans orientation factor62, \(S=\left(3\left\langle {\cos }^{2}\varphi \right\rangle-1\right)/2\), to be 0.61 ± 0.07 for the network, which is consistent with partial in-plane alignment. A value of S = 1 would imply the nanosheets are perfectly aligned in the plane of the film, while S = 0 for randomly oriented nanosheets. This is in broad agreement with a value of S = 0.79 for a vacuum filtered Ti3C2Tx nanosheet network measured using wide-angle X-ray scattering (WAXS)32.
The physical properties of 2D networks are known to scale with nanosheet size63,64. Here, we use FIB-SEM-NT to systematically study the morphology of printed LPE graphene networks for various nanosheet lengths, lNS. Size-selected inks were produced using liquid cascade centrifugation65, characterised by AFM (Fig. 3a) and spray-coated into networks. Reconstructed 3D volumes for networks of two different nanosheet sizes in Fig. 3b show noticeable changes in network morphology as lNS is decreased from 1,087 to 298 nm. Analysis reveals a clear decrease in network porosity from 51% to 39% with decreasing lNS (Fig. 3c), with a corresponding reduction in the characteristic pore size, ζ \(=\sqrt{A}\), in Fig. 3D. The pore circularity data similarly exhibits a dependence on lNS (Fig. 3e), where networks of smaller nanosheets have more circular and compact pore cross-sections. This implies that printed networks comprised of smaller nanosheets are more densely packed, which has been linked to improved charge transfer in graphene films66. Alternatively, networks of larger nanosheets are more open and porous, facilitating enhanced electrolyte infiltration and mass transport. Taken together, the data in Fig. 3c-e suggests that changing the nanosheet size offers a simple means to tailor the network porosity for a target application. FIB-SEM-NT can be used to inform this by measuring pore sizes that span from a few nanometres to microns.
