A large, decades-long population study suggests that the relationship between diet and dementia may hinge on subtle chemical differences in everyday foods and water.


By John Sanford
Researchers from across Stanford’s campus gathered May 7 for a symposium focused on ways synthetic biology can promote a sustainable world.

Next, the study’s authors will examine whether more ZEVs are associated with fewer asthma-related hospitalizations and emergency room visits.
Their work adds to the extensive research on whether EVs are better for the planet long-term than their gas-powered counterparts. Despite imperfections such as mining, the findings are clear on that front. The USC team is showing that when it comes to the air we breathe and public health, the benefits of EVs are undeniable.
“These findings show that cleaner air isn’t just a theory—it’s already happening in communities across California,” declared Sandrah Eckel, the study’s lead author.
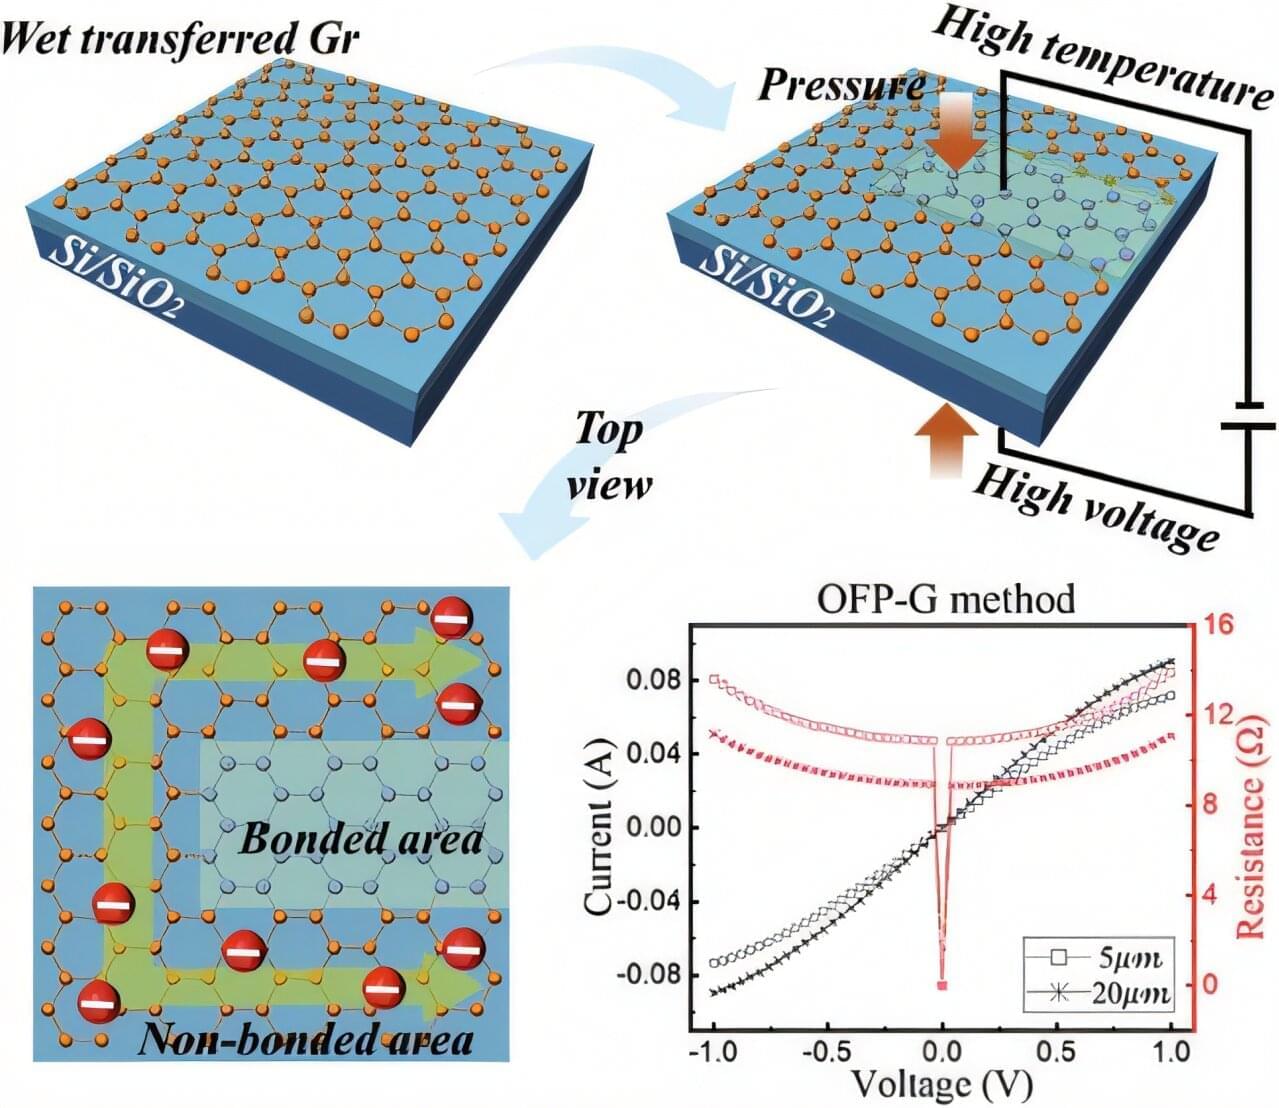
Transparent electrodes transmit light while conducting electricity and are increasingly important in bioelectronic and optoelectronic devices. Their combination of high optical transparency, low electrical resistance, and mechanical flexibility makes them well suited for applications such as displays, solar cells, and wearable or implantable technologies.
In a significant advancement, researchers led by Professor Wonsuk Jung at Chungnam National University in the Republic of Korea have introduced a new fabrication technique called one-step free patterning of graphene, or OFP-G, which enables high-resolution patterning of large-area monolayer graphene with feature sizes smaller than 5 micrometers, without the use of photoresists or chemical etching.
Published Microsystems & Nanoengineering, the method addresses a key limitation of conventional microelectrode fabrication, where lithographic processes often damage graphene and degrade its electrical performance.
New cadets. New era. Infinite possibilities. Catch a new episode of Star Trek: Starfleet Academy every Thursday starting Jan. 15th on Paramount+.
Can quantum tunneling occur at macroscopic scales? Neil deGrasse Tyson and comedian Chuck Nice sit down with John Martinis, UCSB physicist and 2025 Nobel Prize winner in Physics, to explore superconductivity, quantum tunneling, and what this means for the future of quantum computing.
What exactly is macroscopic quantum tunneling, and why did it take decades for its importance to be recognized? We’ve had electrical circuits forever, so what did Martinis discover that no one else saw? If quantum mechanics usually governs tiny particles, why does a superconducting circuit obey the same rules? And what does superconductivity really mean at a quantum level?
How can a system cross an energy barrier it doesn’t have the energy to overcome? What is actually tunneling in a superconducting wire, and what does it mean to tunnel out of superconductivity? We break down Josephson Junctions, Cooper pairs, and other superconducting lingo. Does tunneling happen instantly, or does it take time? And what does that say about wavefunction collapse and our assumptions about instantaneous quantum effects?
Learn what a qubit is and why macroscopic quantum effects are important for quantum computing. Why don’t quantum computers instantly break all encryption? How close are we to that reality, and what replaces today’s cryptography when it happens? Is quantum supremacy a scientific milestone, a geopolitical signal, or both? Plus, we take cosmic queries from our audience: should quantum computing be regulated like nuclear energy? Will qubits ever be stable enough for everyday use? Will quantum computers live in your pocket or on the dark side of the Moon? Can quantum computing supercharge AI, accelerate discovery, or even simulate reality itself? And finally: if we live in a simulation, would it have to be quantum all the way down?
Thanks to our Patrons Fran Rew, Shawn Martin, Kyland Holmes, Samantha McCarroll-Hyne, camille wilson, Bryan, Sammi, Denis Alberti, Csharp111, stephanie woods, Mark Claassen, Joan Tarshis, Abby Powell, Zachary Koelling, JWC, Reese, Fran Ochoa, Bert Berrevoets, Barely A Float Farm, Vasant Shankarling, Michael Rodriguez, DiDTim, Ian Cochrane, Brendan, William Heissenberg Ⅲ, Carl Poole, Ryan McGee, Sean Fullard, Our Story Series, dennis van halderen, Ann Svenson, mi ti, Lawrence Cottone, 123, Patrick Avelino, Daniel Arvay, Bert ten Kate, Kristian Rahbek, Robert Wade, Raul Contreras, Thomas Pring, John, S S, SKiTz0721, Joey, Merhawi Gherezghier, Curtis Lee Zeitelhack, Linda Morris, Samantha Conte, Troy Nethery, Russ Hill, Kathy Woida, Milimber, Nathan Craver, Taylor Anderson, Deland Steedman, Emily Lennox, Daniel Lopez,., DanPeth, Gary, Tony Springer, Kathryn Rhind, jMartin, Isabella Troy Brazoban, Kevin Hobstetter, Linda Pepper, 1701cara, Isaac H, Jonathan Morton, JP, טל אחיטוב Tal Achituv, J. Andrew Medina, Erin Wasser, Evelina Airapetova, Salim Taleb, Logan Sinnett, Catherine Omeara, Andrew Shaw, Lee Senseman, Peter Mattingly, Nick Nordberg, Sam Giffin, LOWERCASEGUY, JoricGaming, Jeffrey Botkin, Ronald Hutchison, and suzie2shoez for supporting us this week.

Astronomers have found thousands of exoplanets around single stars, but few around binary stars—even though both types of stars are equally common. Physicists can now explain the dearth.
Of the more than 4,500 stars known to have planets, one puzzling statistic stands out. Even though nearly all stars are expected to have planets and most stars form in pairs, planets that orbit both stars in a pair are rare.
Of the more than 6,000 extrasolar planets, or exoplanets, confirmed to date—most of them found by NASA’s Kepler Space Telescope and the Transiting Exoplanet Survey Satellite (TESS)—only 14 are observed to orbit binary stars. There should be hundreds. Where are all the planets with two suns, like Tatooine in Star Wars?
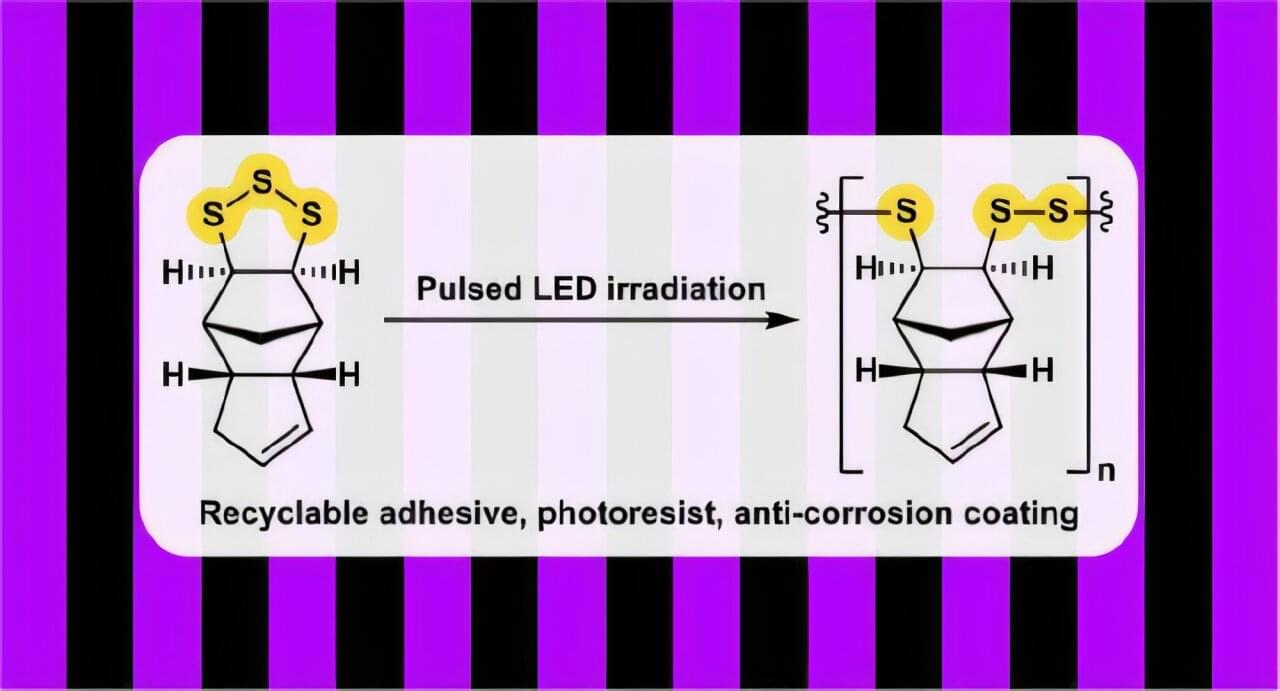
For the first time, scientists have used ultraviolet (UV) light, a low-cost and readily available energy source, to successfully synthesize more sustainable and recyclable polymer materials. Led by green chemistry experts at Flinders University, the development is a major step in making polymers high in sulfur content for more sustainable plastic alternatives using waste materials.
Their paper, “Making and Unmaking Poly(trisulfides) with Light: Precise Regulation of Radical Concentrations via Pulsed LED Irradiation” is published in the Journal of the American Chemical Society.

Industrial dye pollution remains one of the most persistent and hazardous challenges in global wastewater management. The dyes from textile and chemical manufacturing sectors are difficult to remove, non-biodegradable, and can be toxic to plants, animals, and humans. However, conventional treatment technologies for dyes often fail to efficiently purify the wastewater without significant trade-offs.
To remedy this issue, researchers from Tohoku University developed a three-dimensional covalent organic framework (COF), TU-123, that enables highly efficient and selective removal of anionic dyes from contaminated water.
The highly porous COF acts like a sponge—trapping dyes for easier separation. This work establishes a new structural blueprint for constructing highly connected imidazole-linked three-dimensional COFs. Furthermore, it opens sustainable pathways for advanced wastewater purification technologies.
New technology from University of Houston researchers could improve the way devices manage heat, thanks to a technique that allows heat to flow in only one direction. The innovation is known as thermal rectification, and was developed by Bo Zhao, an award-winning and internationally recognized engineering professor at the Cullen College of Engineering, and his doctoral student Sina Jafari Ghalekohneh. The work is published in Physical Review Research.
A new way to steer heat
This new technology gives engineers a new way to control radiative heat with the same precision that electronic diodes control electrical currents, which means longer-lasting batteries for cell phones, electric vehicles and even satellites. It also has the potential to change our approach to AI data centers.
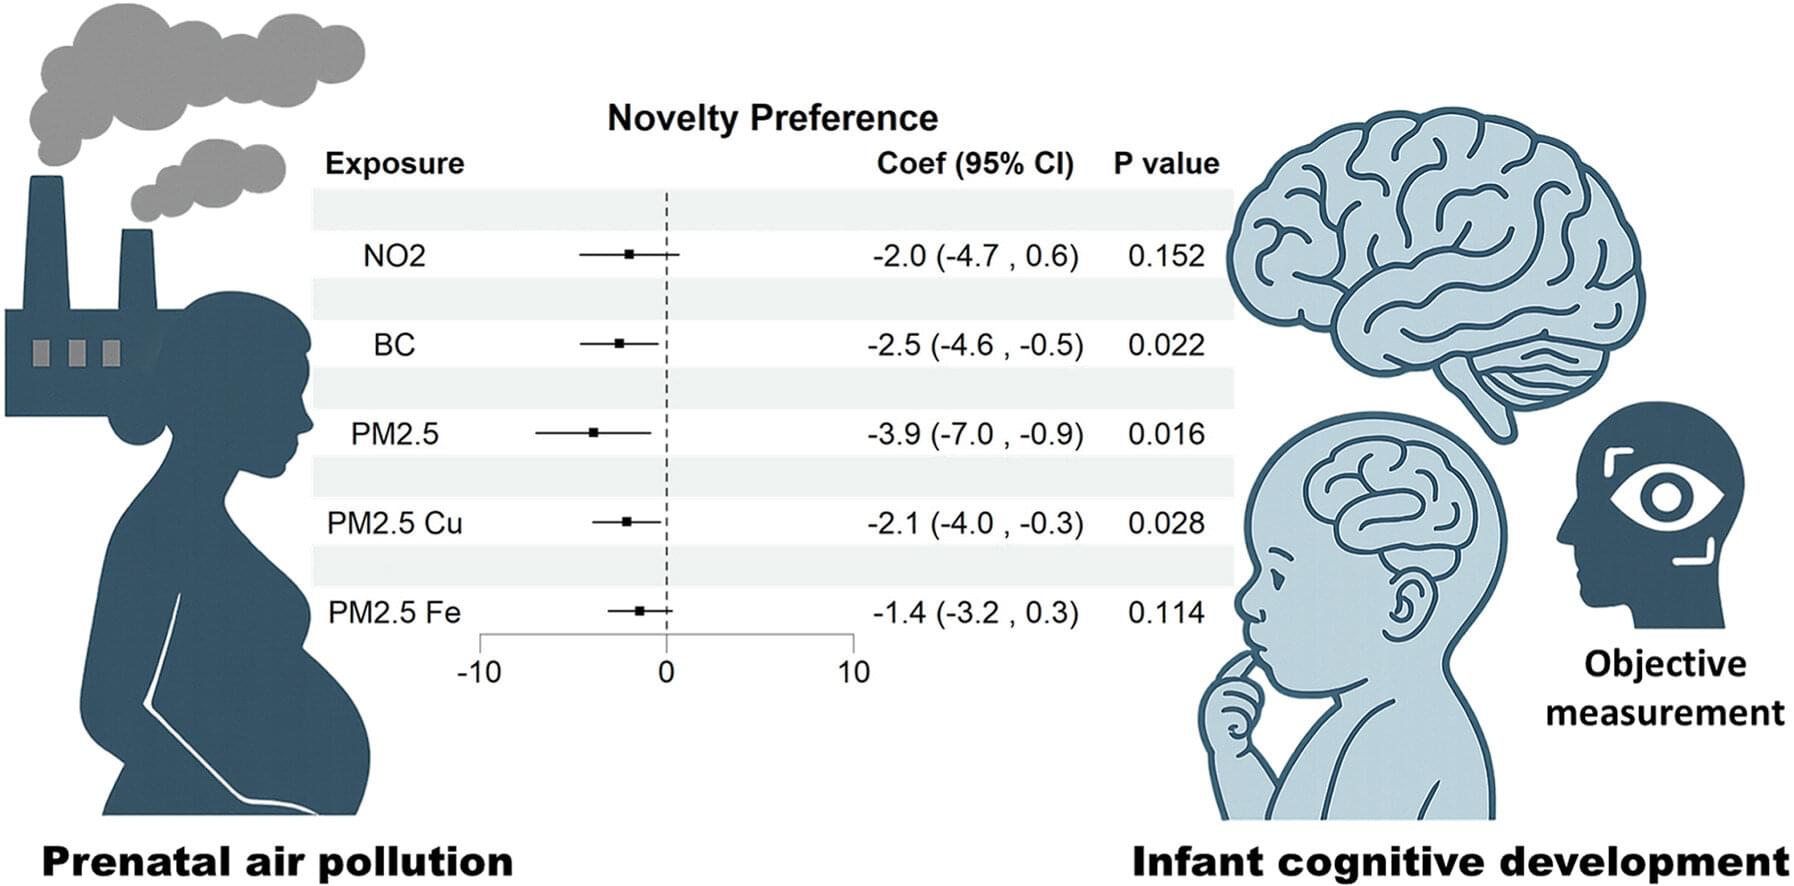
The prenatal period is a critical window for brain development, yet few studies have examined the impact of air pollution exposure during pregnancy on child cognition. A new study led by the Barcelona Institute for Global Health (ISGlobal), in collaboration with the University of Barcelona (UB), shows that prenatal exposure to pollution is associated with lower cognitive performance in newborns.
These findings highlight the importance of reducing air pollution exposure, especially during pregnancy, to protect neurodevelopment.
The study, published in Environmental Pollution, included data from 168 mother-child pairs participating in the BiSC (Barcelona Life Study Cohort) project, conducted in Barcelona between 2018 and 2023.