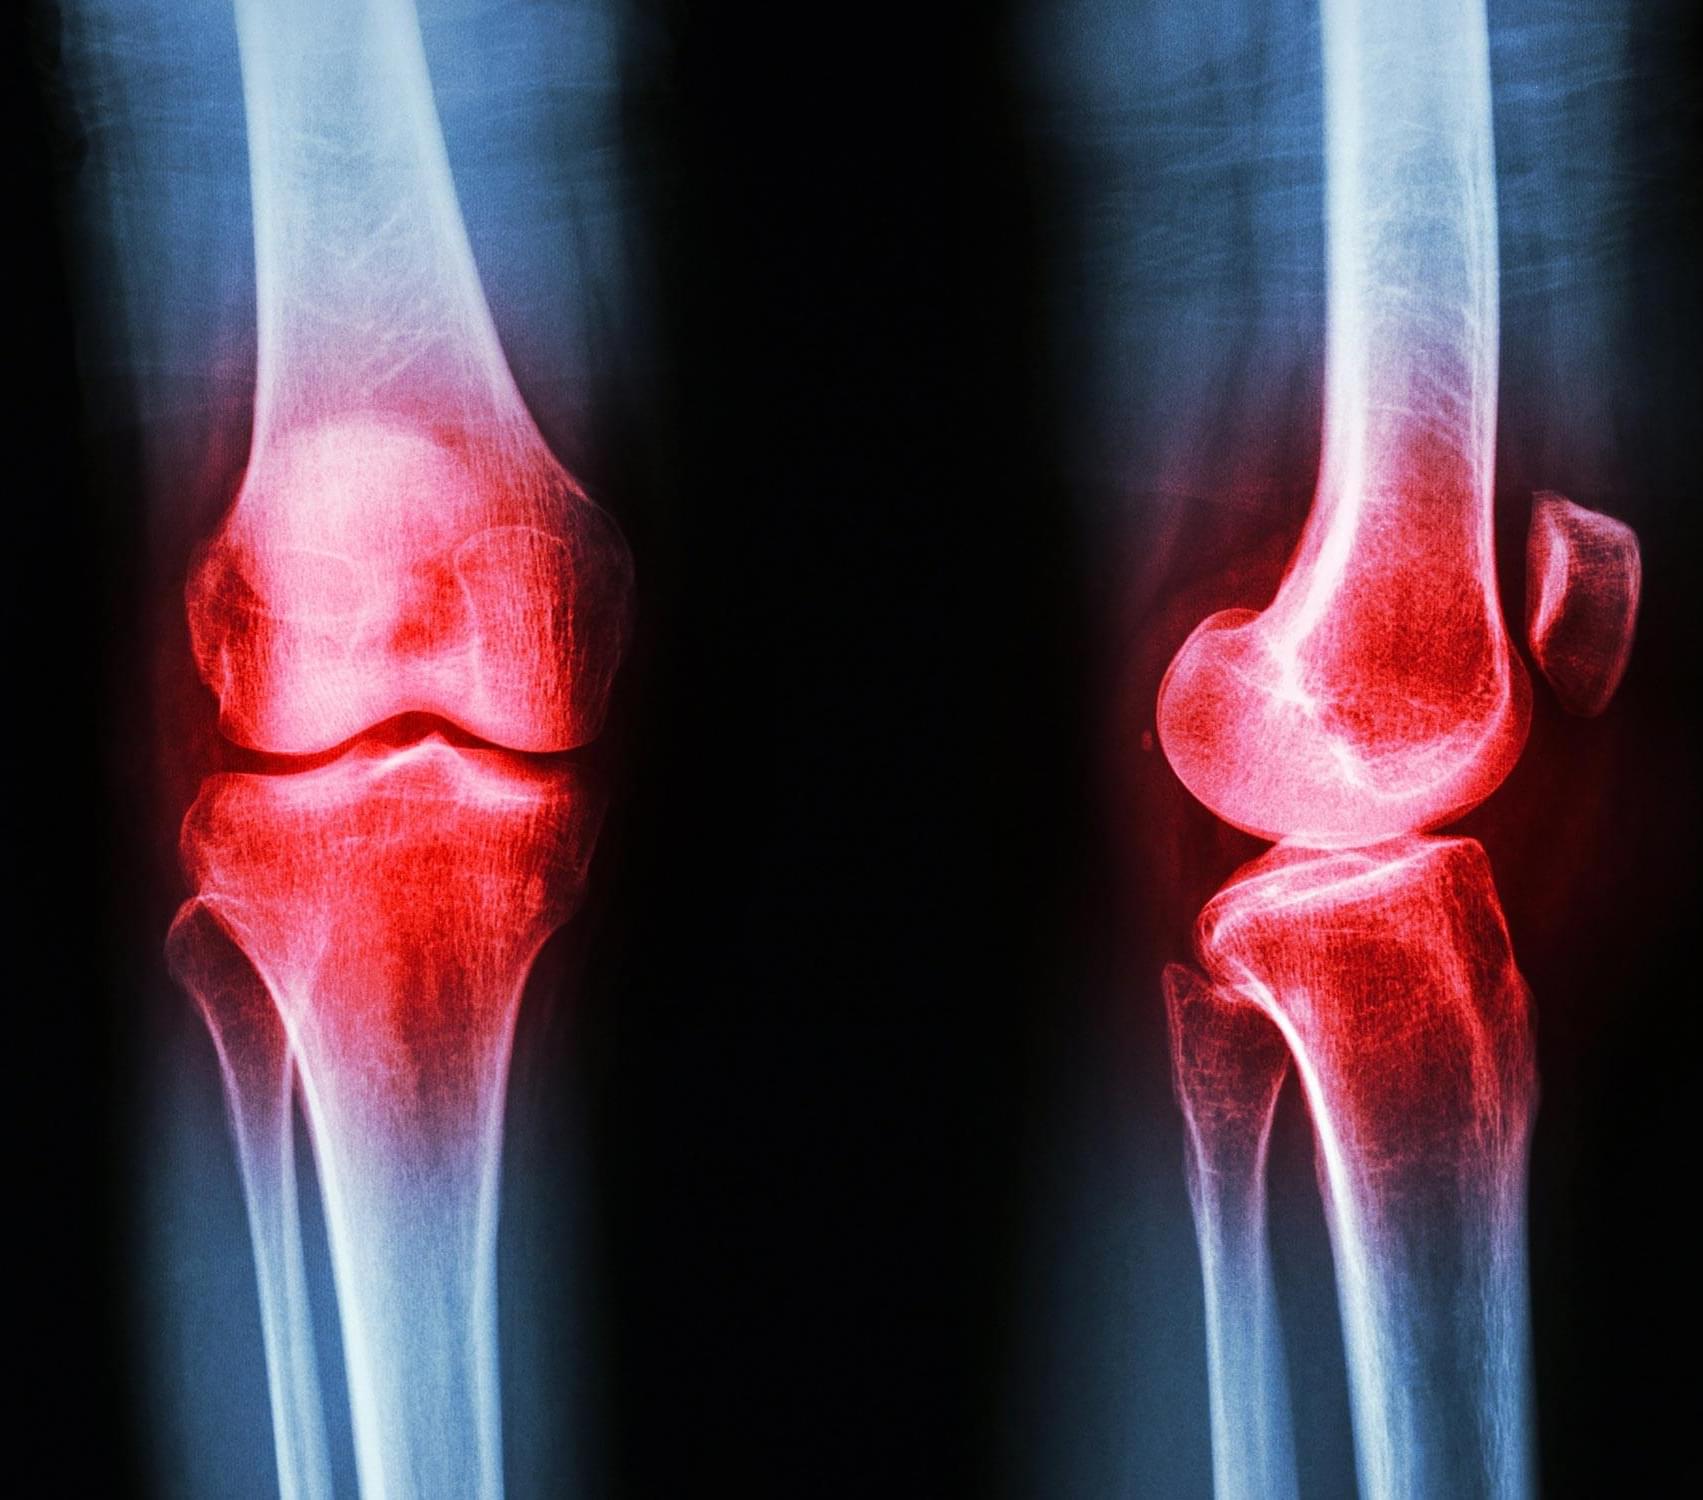
Exercise is the most effective and underused treatment for osteoarthritis, protecting joints while improving overall health.


Chromosomes are masters of organization. These long strings of DNA fold down into an ensemble of compact structures that keep needed parts of the genome accessible while tucking away those that aren’t used as often. Understanding the complexity of these structures has been challenging; chromosomes are large systems, and deciphering the structure and dynamics requires a combination of experimental data and theoretical approaches. The FI-Chrom method, shared in a recent PNAS publication by Rice’s José Onuchic and Vinícius Contessoto, is a new and effective approach for creating 3D maps of chromosomes from real-world data.
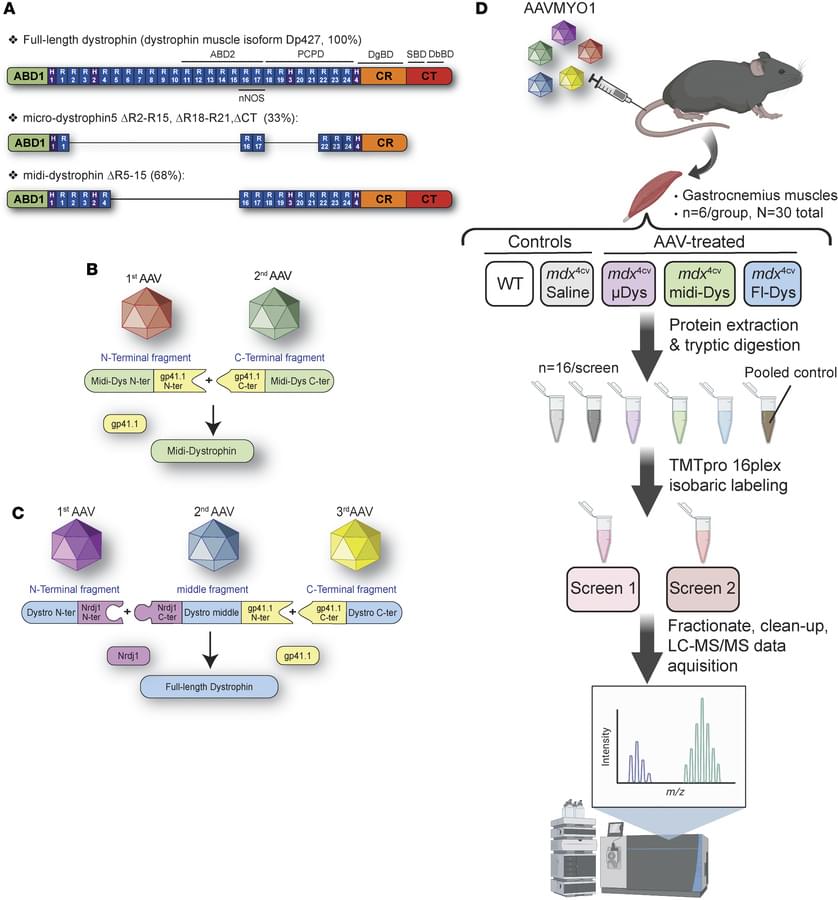
FI-Chrom uses data from chromosome Hi-C maps. These maps break out the chromosome into units of length called beads — about 500,000 linear DNA bases each — and show how frequently each bead is close to other beads. This information shows only probabilities of any two beads being neighbors and no direct three-dimensional information. Imagine it as a logic puzzle where the rules, or parameters, read something like this: Bead A is 99% likely to be close to Bead B, 36% likely to be close to Bead C and 62% likely to be close to Bead D. A 3D model, the researchers knew, could be built by placing every bead in a space that didn’t violate any of the Hi-C map’s parameters. The only problem is that in Hi-C maps, there are hundreds of thousands of beads and tens of millions of mapped interactions showing bead closeness.
“We had chromosome maps that gave us, theoretically, 3D information, but we were really reading them in 2D space,” explains Onuchic, the Harry C. and Olga K. Wiess Chair of Physics and a corresponding author of the study. “Now, we have created FI-Chrom, an open-access program that can turn these Hi-C maps into 3D models of chromosomes.”

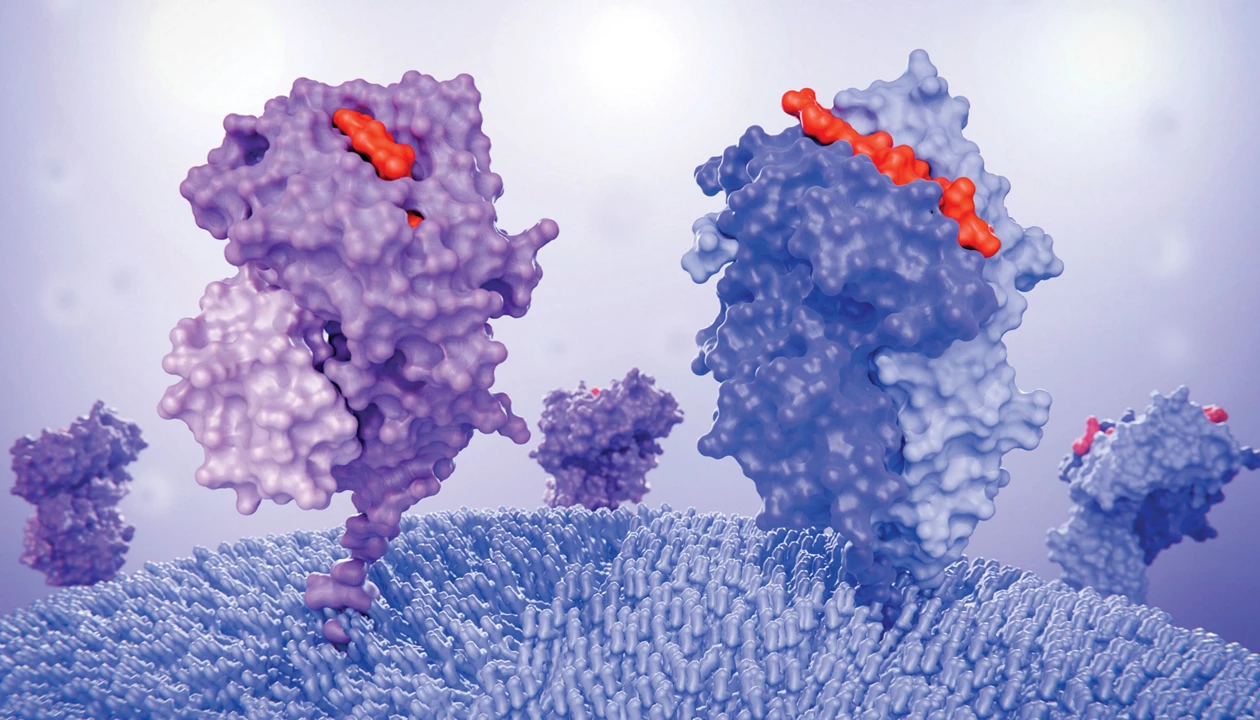
Cells routinely present peptide fragments from their proteome for immune surveillance, using major histocompatibility complex (MHC) proteins as a display window. In this study, researchers introduced viral peptides to be processed and displayed on cancer cells.
One molecule combines two approaches to waken dormant immunity against tumors by Laurel Oldach.

Here, Hichem Tasfaout & team describe a new method for using proteomics to evaluate the efficacy of three dystrophin-replacement approaches using AAV vectors.
1Department of Biochemistry, Molecular Biology and Biophysics, University of Minnesota — Twin Cities, Minneapolis, Minnesota, USA.
2Department of Neurology.
3Senator Paul D. Wellstone Muscular Dystrophy Specialized Research Center, and.
4Department of Biochemistry, University of Washington School of Medicine, Seattle, Washington, USA.
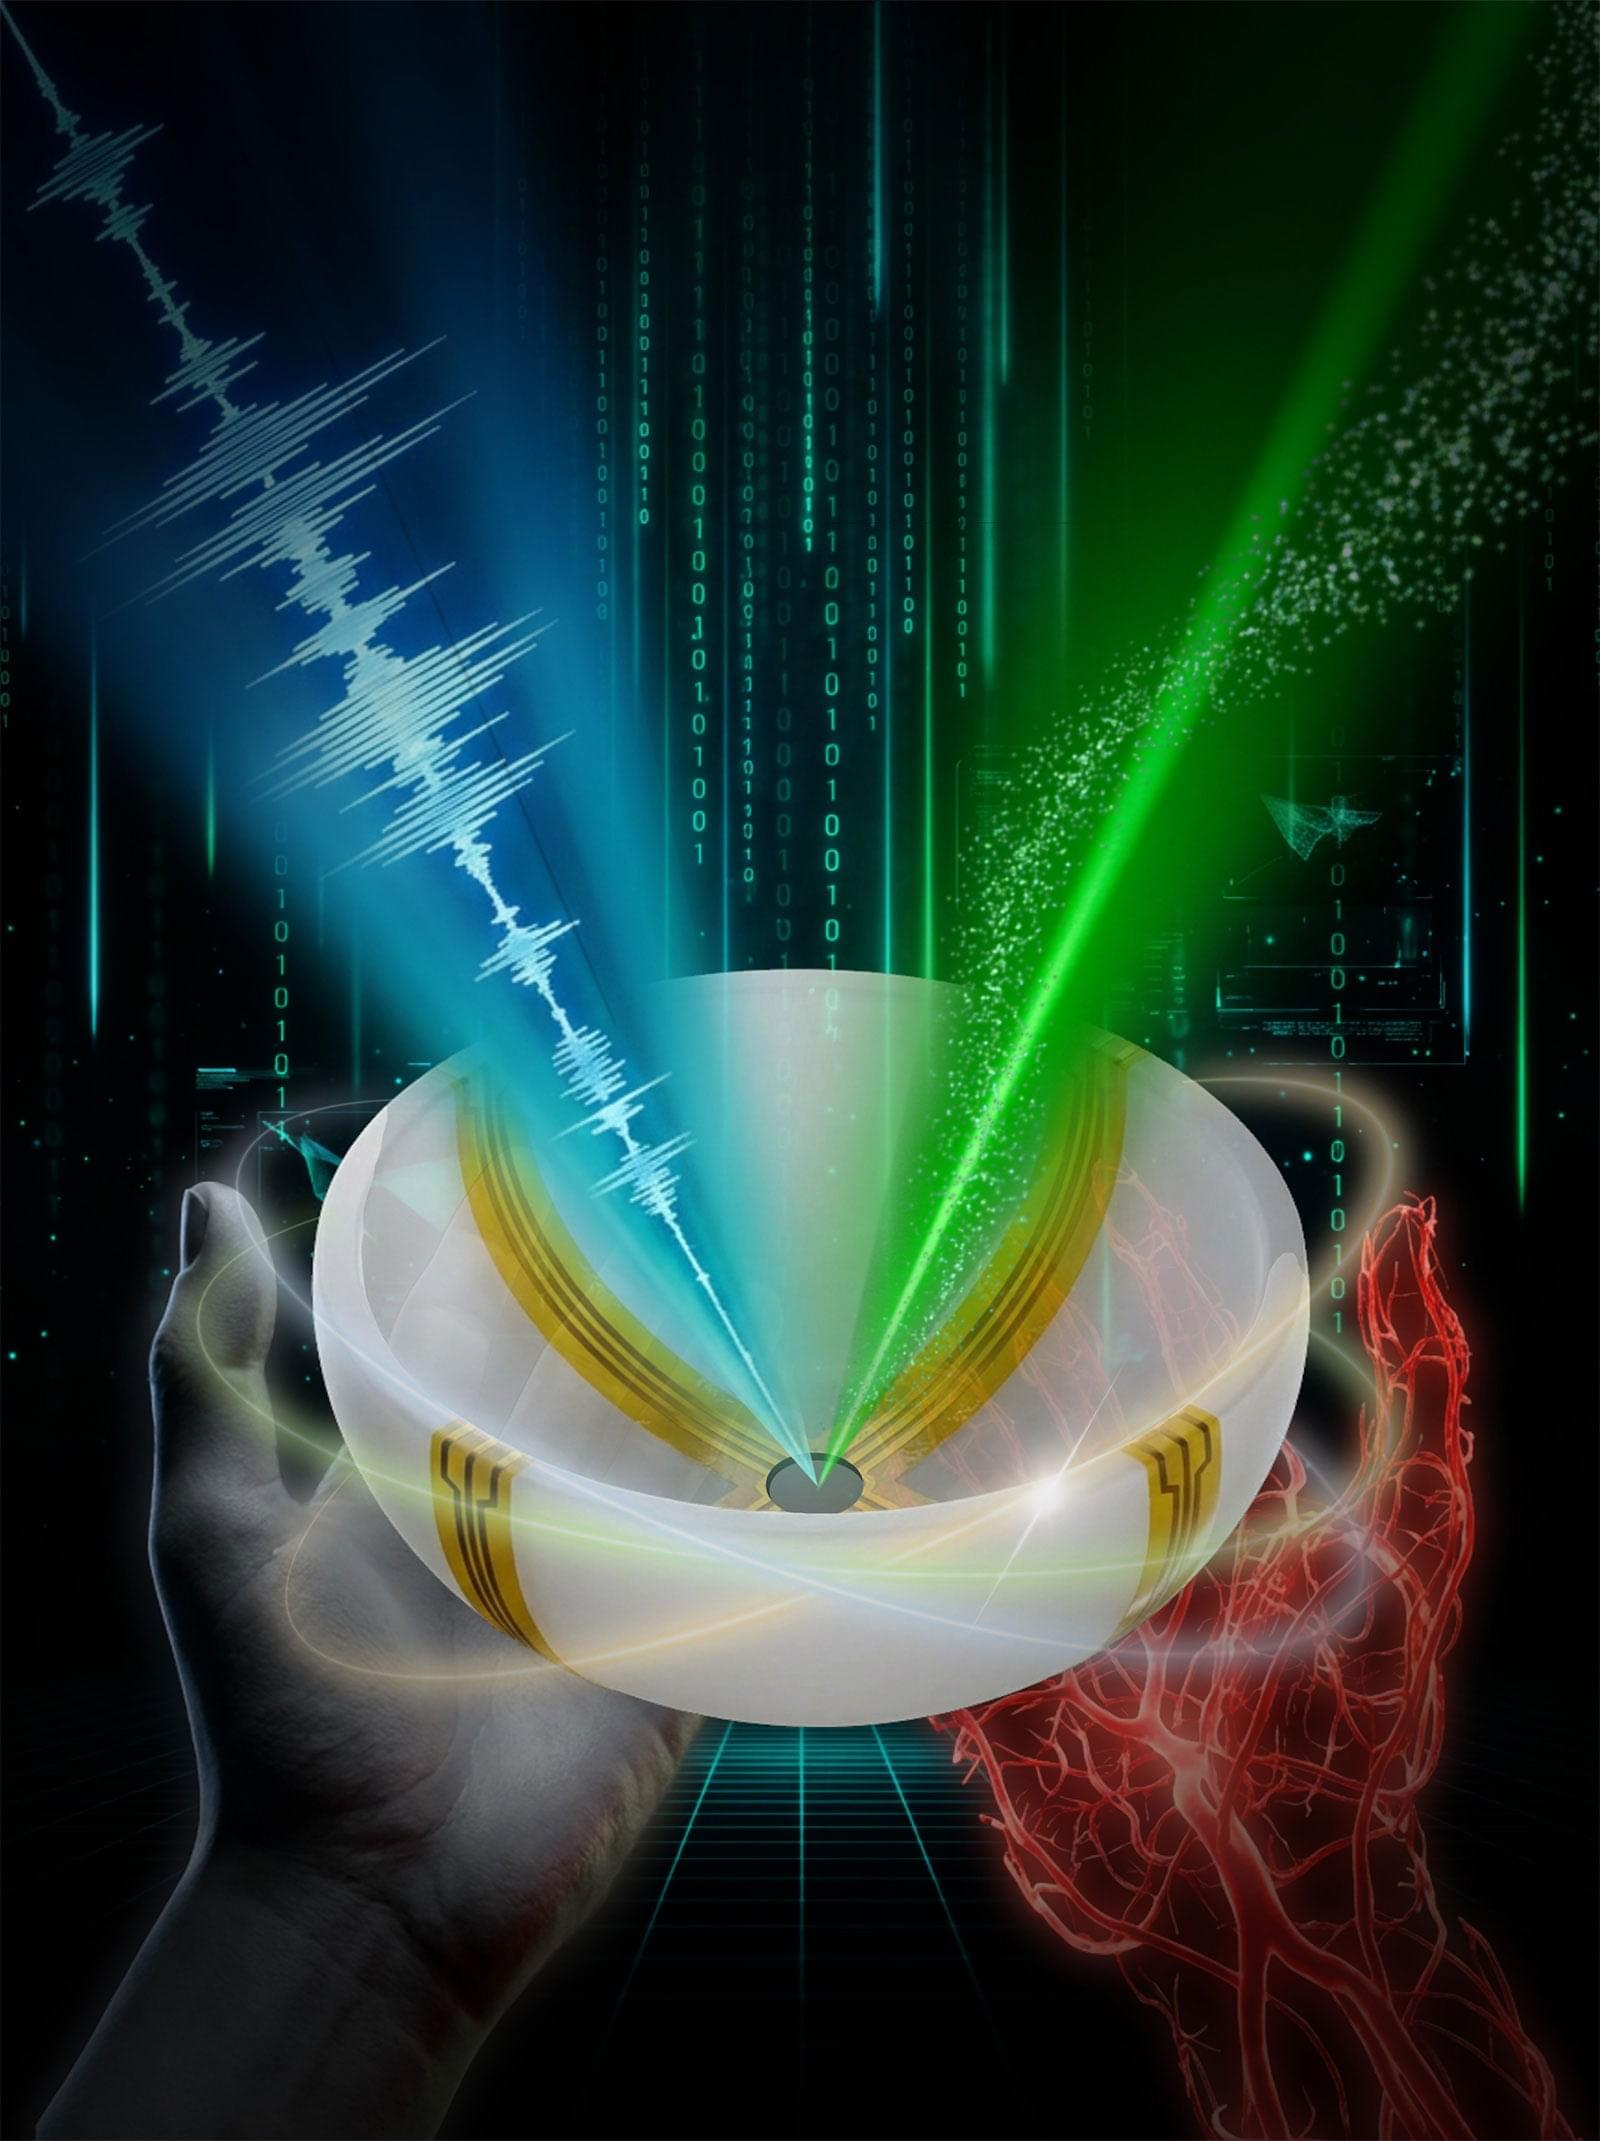
Statin therapy before and during anthracycline-based chemotherapy resulted in fewer cases of elevated pulse wave velocity and reduced aortic distensibility compared with placebo. The results suggest a potential protective effect of atorvastatin against vascular dysfunction in cancer survivors.
Question Does 12 months of treatment with atorvastatin mitigate anthracycline-associated increased aortic stiffness, an important factor associated with adverse cardiovascular outcomes?
Findings In this secondary analysis of 300 participants with lymphoma enrolled in the STOP-CA (Statins to Prevent the Cardiotoxicity From Anthracyclines) randomized clinical trial, atorvastatin was associated with significantly lower odds of an increase (≥0.8 m per second) in magnetic resonance imaging–derived aortic arch pulse wave velocity, compared with placebo. The proportion of participants meeting this primary exploratory end point was significantly lower with atorvastatin (5%), compared with placebo (50%).
Meaning These findings suggest that pretreatment with atorvastatin is associated with preserved vascular function in patients undergoing anthracycline treatment.
Now online! (Cell 186786–802.e1–e15; February 16, 2023)
Now online! (Cell 186, 786–802.e1–e15; February 16, 2023)
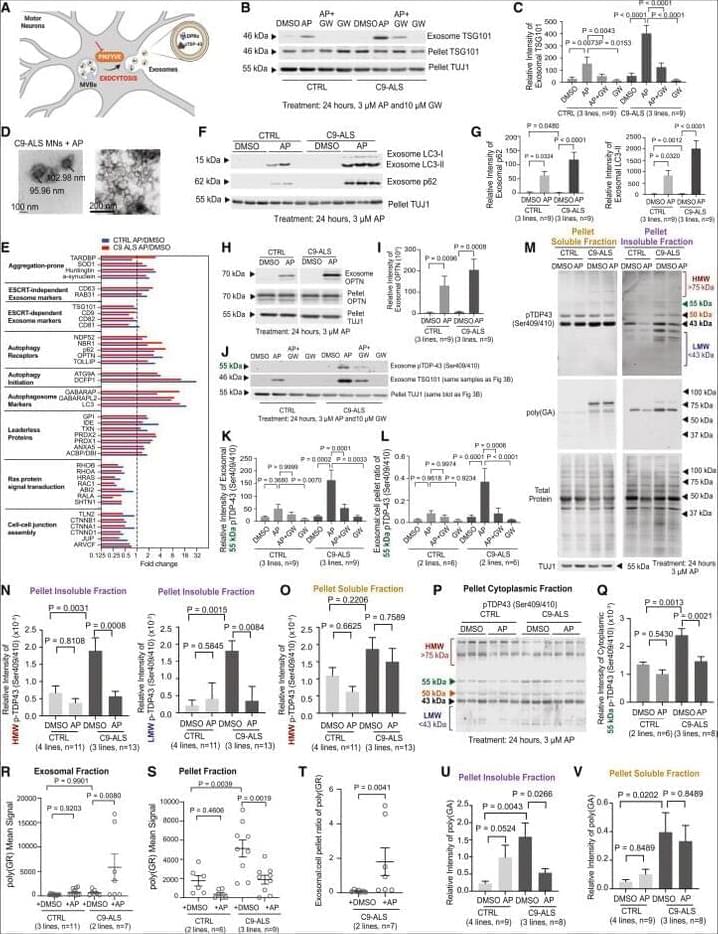
In our original published article, we performed western blots and imaging of induced motor neurons (iMNs) to elucidate the mechanism through which PIKFYVE inhibition causes secretion and clearance of aggregation-prone proteins such as phosphorylated TDP-43 (pTDP-43). Since publication, we have become aware of 3 errors in figure legends or images that we are now correcting.